Research Analysis
Can AI Choose the Right Statistical Test? What 2026 Benchmarks Reveal
Recent benchmarks examine whether AI can move from a research question and dataset to an appropriate statistical method, valid result, and defensible conclusion—and where human verification remains essential.
By DomyClass
Published
At a glance
- What is being tested
- Recent benchmarks examine different parts of statistical work: selecting candidate methods, using tools, generating code, calculating results, and writing conclusions. They do not measure one interchangeable notion of being “correct at statistics.”References:S01S03S05S07
- Publication status
- Fisher-R1/P-Bench and StatABench are current arXiv v1 preprints. StatLLM is a peer-reviewed Scientific Data Data Descriptor. StatQA is peer-reviewed 2024 background research rather than a 2026 frontier-model evaluation.References:S01S03S05S07
- Why code is not enough
- Executable code establishes that an instruction ran in a particular environment. It does not establish that the research question, observational unit, dependence structure, assumptions, estimand, or interpretation are valid.References:S05S08S09S10
- Evidence-bounded conclusion
- AI can accelerate statistical work, but executable code and a plausible numerical result do not by themselves establish that the chosen method or resulting conclusion is statistically valid.References:S01S03S05S11S12
- Research review date
- The paper versions, releases, and official guidance used in this analysis were reviewed through August 29, 2026.
What choosing the “right statistical test” actually requires
A test name should come near the end of the reasoning process, not the beginning. First identify the population and the quantity to estimate: a mean difference, a change within the same unit, an association, a proportion, a rate, a time-to-event contrast, or something else. Then establish how observations entered the dataset, which variables are outcomes and predictors, whether measurements are independent or linked, and what inference the design can support.
The same column types can represent unrelated samples, repeated people, matched facilities, or clustered transactions. A binary outcome may come from a randomized experiment or an observational survey. These designs create different targets and threats to validity. A language model cannot recover facts that were never recorded merely by inspecting a spreadsheet.
Missingness, outliers, censoring, unequal exposure, ties, small cells, repeated looks, and multiple outcomes can change the plan. Checks should combine subject knowledge, design information, plots, and diagnostics appropriate to the model. A preliminary test is not a universal gate that selects the next procedure. NIST guidance treats exploration, assumption checking, fitting, and validation as connected work.
Finally, the intended claim must match the design. An association estimated from observational data does not become causal because a regression produced a small p-value. A statistically detectable effect is not automatically large, important, or useful. The ASA’s principles emphasize that a p-value does not state the probability that the null hypothesis is true and that scientific conclusions should not turn on a threshold alone.
Sources:S11
What the 2026 benchmarks test
P-Bench and Fisher-R1. Fisher-R1: Training LLM Agents for Reliable Hypothesis Testing is an August 2026 arXiv v1 preprint, not an established peer-reviewed publication. P-Bench contains 425 open-ended tasks divided into 203 Easy and 222 Hard cases. The current public release identifies 405 rows as nonsynthetic and 20 as synthetic, which qualifies the paper’s broader real-world framing. For each task, an agent receives a question and CSV, uses an R sandbox, and returns a method, p-value, and reject-or-fail-to-reject decision.
Raw scores the decision direction. Strict also requires the reported p-value to be close to the canonical value on the paper’s transformed scale. It does not directly score whether the named method is correct. In Table 1, GPT-5.4 recorded 58.3% Raw pass@1 and 30.5% Strict pass@1 on the Hard split under that three-rollout setup. The gap can reveal numerical disagreement, but is not a universal GPT-5.4 score or proof that each Strict failure used the wrong method.
Sources:S01
StatABench. This June 2026 arXiv v1 preprint has two distinct tracks. Stat-Closed contains 404 tasks across 18 topics, including 198 practical tasks that use a 35-function Python toolkit. Stat-Open contains 30 competition-derived projects assessed through a report-scoring process. These are not 434 interchangeable questions. Under the paper’s Stat-Closed setup, GPT-5.1 achieved 68.6% overall accuracy across heterogeneous formats; that number is not a pure test-selection rate.
Configuration also mattered. On the practical subset, DeepSeek-V3 scored 53.54% with the LangChain MCP baseline and 85.35% with CrewAI. That comparison shows that orchestration can alter benchmark results substantially. It does not establish that CrewAI is always superior: the direction and size of changes differed across model-framework pairings.
Sources:S03
StatLLM and StatQA. StatLLM is a peer-reviewed 2026 Scientific Data Data Descriptor covering 65 datasets, 207 specified SAS tasks, and 621 outputs. Nine experts separated correctness, execution, and output quality. With prescribed requests and older named systems, it informs multidimensional evaluation rather than current independent test selection.
StatQA, a peer-reviewed NeurIPS 2024 benchmark, tests constrained selection of applicable methods and columns from supplied metadata and fixed candidates. Its 11,623 examples, including a 1,163-item mini benchmark, are useful background, but do not reproduce open-ended raw-data diagnosis or measure 2026 frontier systems.
Sources:S07
Benchmark comparison
The benchmarks illuminate different stages of statistical work. Their percentages should remain inside their own task, tool, model, and scoring contexts. Because the task sets and scoring methods differ, the percentages are not directly comparable.
| Benchmark and status | Task format and count | Required output | Evaluation method | What it reveals | Important limitation |
|---|---|---|---|---|---|
| P-Bench — arXiv v1 preprint | 425 open-ended question-and-CSV tasks: 203 Easy and 222 Hard. | R analysis, method, p-value, and decision. | Decision match, with a stricter transformed p-value proximity condition. | Tests an agent’s end-to-end hypothesis-testing workflow in its stated domains. | Method correctness is indirect; one test per task; R-only and domain-limited.References:S01S02 |
| Stat-Closed — arXiv v1 preprint | 404 tasks across 18 topics and varied formats; 198 practical tasks use a 35-function toolkit. | Answers, tool choices, parameters, execution, or interpretation, depending on format. | Direct matching plus judging for some responses. | Separates several statistical abilities and exposes tool-orchestration effects. | Heterogeneous formats prevent interpreting overall accuracy as a pure selection rate.References:S03S04 |
| Stat-Open — arXiv v1 preprint | 30 competition-derived open projects with data. | A structured end-to-end analysis report. | Judge rubric with a human comparison. | Examines broader analysis planning and reporting. | The judge-dependent report score is not an accuracy percentage.References:S03S04 |
| StatLLM — peer-reviewed Data Descriptor | 65 datasets, 207 specified SAS tasks, and 621 outputs. | SAS code and output for a prescribed request. | Nine experts applied ten criteria spanning correctness, execution, and output quality. | Shows why statistical code needs multidimensional evaluation. | Does not independently test initial method selection and does not cover current frontier systems.References:S05S06 |
| StatQA — peer-reviewed 2024 background benchmark | 11,623 constrained examples, including a 1,163-item mini benchmark. | Exact lists of relevant columns and methods from supplied metadata and candidates. | Strict exact match. | Tests statistical applicability and column identification under constrained choices. | Synthetic or template-driven tasks omit open-ended raw-data diagnosis and major method families.References:S07 |
Taken together, the evidence supports a narrow conclusion: statistical automation needs evaluation at more than one layer. A system may identify a familiar procedure but mishandle parameters, execute correct syntax for the wrong estimand, or report a direction that is not supported by its own numerical analysis. Conversely, a lower score may reflect output parsing or an orchestration constraint rather than one indivisible lack of statistical intelligence.
Where AI can help with statistical analysis
An AI assistant can be useful before, during, and after computation when its work is treated as a reviewable proposal. Before analysis, it can ask: What is the observational unit? Which units repeat? Was assignment random? Are there clusters, weights, censoring, or multiple outcomes? It can summarize a data dictionary, flag inconsistent codes, and inventory missing information rather than guess.
During analysis, it can propose candidate methods with reasons and disqualifying conditions, write commented code, generate plots, check residuals, compare specifications, and trace exclusions. The analyst must still read the code and verify package defaults. P-Bench and StatABench show executable agent workflows; StatLLM shows why execution should be assessed separately from analytical correctness.
After analysis, AI can translate output into a draft explanation, build a checklist of caveats, and compare the result with sensitivity analyses. It can ask whether effect estimates and intervals tell a different story from a thresholded p-value. It can also reveal its own uncertainty by naming missing fields, competing interpretations, and the evidence that would change its recommendation.
Where AI can fail even when the code runs
Runnable code proves only that a particular instruction was executable in a particular environment. It does not prove that rows are independent, that the target variable means what the prompt claims, that missingness is ignorable, or that the model answers the intended question.
Common failures include treating repeated observations as independent; selecting a test from keywords; accepting default row deletion; confusing linear with monotonic association; applying a small-cell rule without the sampling design; ignoring clustering; or selecting the smallest result after many analyses. A system can also calculate association correctly and then use unsupported causal language.
Interpretation can fail after correct computation. A p-value concerns data-model compatibility under assumptions, not the probability that a claim is true. Failure to reject is not proof of no effect. Significance does not state magnitude, practical value, or replicability. Estimates, intervals, diagnostics, sensitivity checks, and context remain necessary.
Automation adds its own risks. A model may invent a variable definition, silently change a hypothesis, select an unavailable package function, or produce a polished explanation that obscures uncertainty. StatABench’s framework-dependent results show that the wrapper and tools are part of the evaluated system. The NIST Generative AI Profile similarly treats confabulation, validation, monitoring, and the human-AI configuration as risk-management concerns.
Four original method-selection examples
The following fictional examples are original teaching scenarios. They are not benchmark tasks, field reports, assignment answers, or answer keys. Each shows what an AI assistant might notice, what it could miss, what a human should verify, and which absent facts prevent a final choice.
Example A — Independent or paired observations?
A regional repair company records safety-inspection time before and after technicians receive a new checklist, and the same technicians may appear in both periods. What AI might notice: repeated technician identifiers make an independent-groups analysis suspect, and jobs may also cluster by workshop. What AI might miss: job complexity changed and each technician contributes several jobs. Human verification: confirm the observational unit, link records correctly, inspect within-technician changes, and decide whether pairing, repeated measures, or a multilevel model matches the target. Information still needed: complete follow-up, measured complexity, concurrent changes, and the intended unit of inference. A paired t-test is a candidate, not an automatic answer.
Example B — Student’s or Welch’s two-sample analysis?
Two unrelated delivery centers compare average package-sorting time after adopting different layouts. The centers differ greatly in size, and shutdown days created extreme delays. What AI might notice: the groups are independent, spreads appear unequal, and Welch’s comparison plus plots and robust sensitivity checks deserve consideration. What AI might miss: one center averaged by shift while the other recorded each package, so rows are incomparable; it may also use a variance-test threshold as an automatic switch. Human verification: align units and time windows, investigate extremes, define whether means answer the question, and compare defensible models. Information still needed: day-level dependence, service mix, and whether the estimand is a package mean, shift mean, or percentile. Student versus Welch cannot be settled without the target and design.
Example C — Pearson or Spearman association?
A subscription service studies whether account age is associated with quarterly help-request counts. What AI might notice: the scatterplot is curved but generally increasing, counts are tied, and a few older accounts are influential; Pearson targets linear association while Spearman is rank-based and monotonic. What AI might miss: larger accounts are older and submit more requests, yet the system may use causal language. Human verification: define the target, inspect plots, assess influential observations and ties, consider count models or stratification, and respect the observational design. Information still needed: account size, exposure, product tier, and repeated quarters. “Non-normal means Spearman” is not an adequate rule.
References:S15
Example D — Chi-square or Fisher’s exact procedure?
A manufacturer tabulates equipment-fault category against maintenance protocol for a new machine family, with several sparse cells. What AI might notice: the data form a contingency table and chi-square, an exact procedure, or simulation-based inference may be candidates. What AI might miss: machines contribute repeated visits and protocol assignment depended on site risk. Human verification: reconstruct sampling, identify repeated machines and clustering, confirm table dimensions and conditioning assumptions, and define the inferential objective. Information still needed: how protocols were assigned, whether the target is association or adjusted inference, and how repeat visits were counted. No universal sample-size cutoff resolves those design questions.
A human-verification workflow
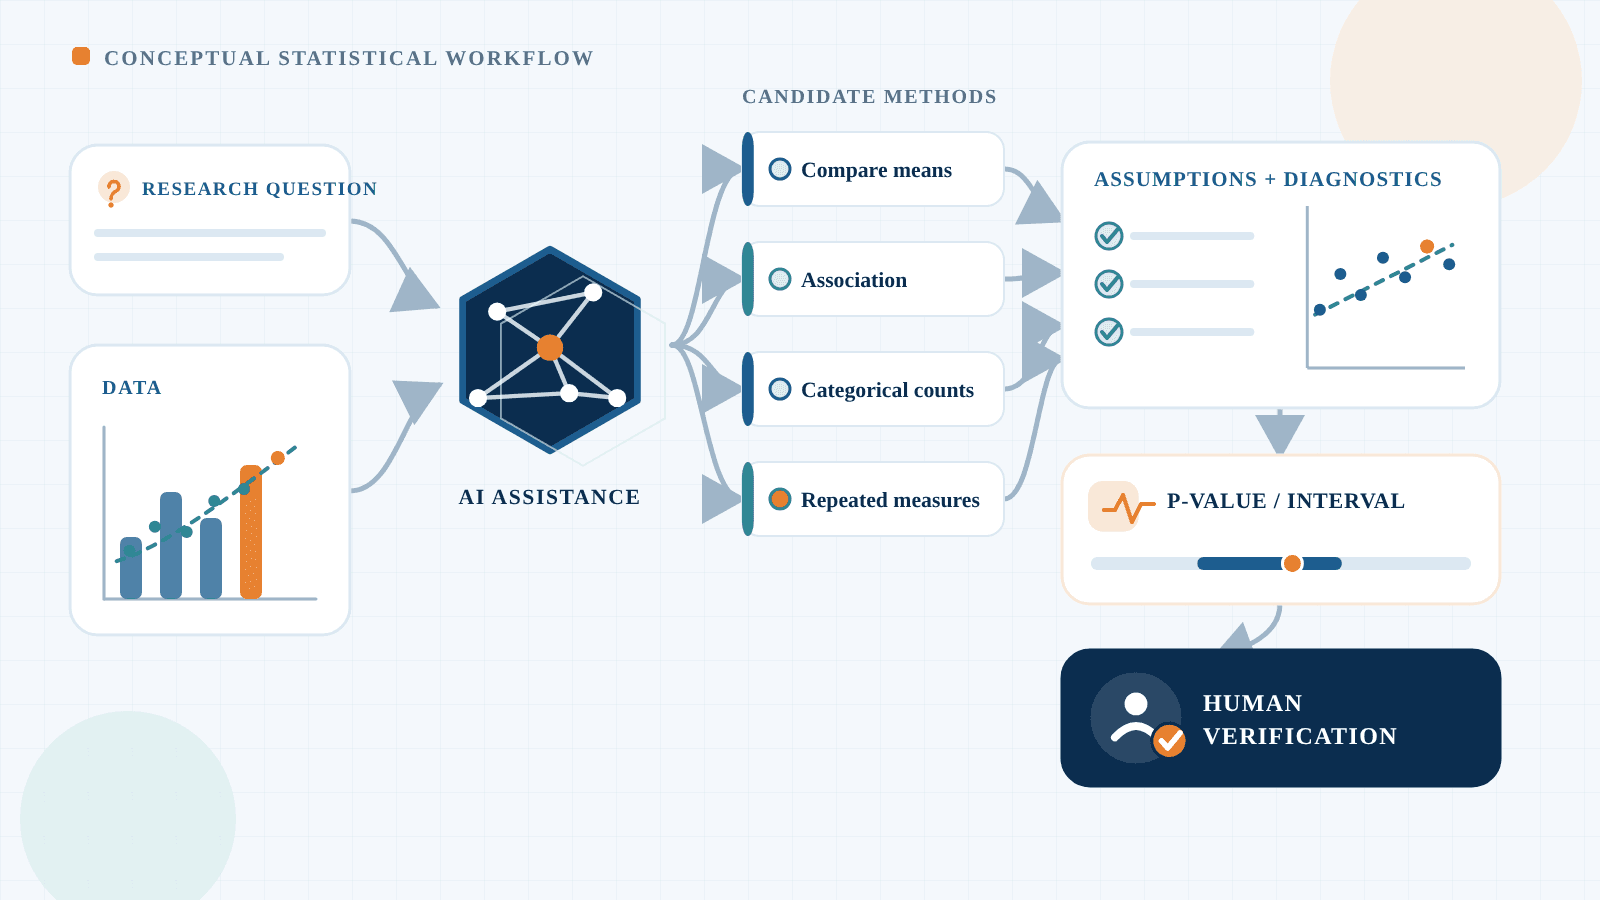
A reviewable sequence keeps method selection connected to design and reporting: Research question → Study design → Variable types → Data quality → Assumptions → Candidate methods → Analysis → Diagnostic and sensitivity checks → Interpretation → Reporting and limitations.
| Stage | What a human verifies |
|---|---|
| 1. Research question | Freeze the population, estimand, outcome, comparison, direction, time window, and exploratory or confirmatory purpose.References:S08 |
| 2. Study design | Identify sampling, assignment, matching, repeated units, clusters, weights, censoring, exclusions, and the strongest claim the design supports.References:S08S09 |
| 3. Variable types | Confirm what each field measures, its scale and coding, and which variables are outcomes, predictors, strata, or identifiers.References:S08 |
| 4. Data quality | Trace transformations, reconcile units, quantify missingness, inspect outliers and impossible values, and record exclusions reproducibly.References:S08S09 |
| 5. Assumptions | Use design knowledge, plots, and diagnostics that match the candidate model; do not rely on one universal preliminary-test switch.References:S09S10 |
| 6. Candidate methods | Compare alternatives, required assumptions, failure conditions, estimands, and diagnostics before choosing.References:S08S09S10 |
| 7. Analysis | Pin software versions, inspect functions and defaults, rerun from clean inputs, and independently check key quantities.References:S05S12 |
| 8. Diagnostics and sensitivity | Examine influential observations, plausible missing-data choices, alternative specifications, and multiplicity.References:S09S10S11 |
| 9. Interpretation | Connect estimates, intervals, and p-values to the design without converting association into causation or significance into importance.References:S11 |
| 10. Reporting and limitations | Document data, code, choices, uncertainty, sensitivity, limitations, responsibility, and escalation paths.References:S11S12S13S14 |
Human review can itself fail. A reviewer may lack the needed expertise, trust a polished answer, face incentives to approve quickly, or repeat the same mistaken assumptions. Effective oversight therefore needs named responsibility, adequate time, access to source data and code, escalation paths, and authority to stop the analysis. A second AI output is not independent validation.
How students can prompt an AI tool more effectively
A useful prompt asks the system to expose reasoning dependencies before it names a procedure. For example: Help me plan an analysis; do not choose a final test until you list the missing design information. Restate my population, observational unit, outcome, comparison, and estimand. Identify dependence, clustering, missingness, outliers, multiplicity, and causal limits. Give candidate methods, assumptions, diagnostics, and conditions that would rule each candidate out. Then provide commented code and a verification checklist. Do not invent variable meanings or data I have not supplied.
Attach a de-identified data dictionary and describe how observations were collected. State whether units repeat, whether groups were assigned, what happened before measurement, which exclusions were planned, and which outcome was primary. Ask the tool to separate facts from assumptions and to mark unresolved questions.
Request alternatives. Ask what plot or design fact would change the recommendation, which defaults need review, and how reasonable sensitivity analyses affect the conclusion. For classwork, use the response to understand and document your reasoning; do not request an answer key or present generated work as your own. Follow your institution’s current AI-use and academic-integrity requirements.
Better prompting improves transparency, not truth by itself. A detailed prompt cannot restore unrecorded pairing, repair biased sampling, or establish causality. The student or analyst remains responsible for checking the method against course requirements, disciplinary conventions, and the actual data-generating process.
AI governance and business risk
For an organization, a statistical recommendation may influence pricing, hiring, product experiments, quality controls, clinical or safety escalation, and resource allocation. A wrong method can therefore become an operational, compliance, financial, or reputational risk even when the immediate artifact is only a notebook.
NIST AI RMF 1.0 is voluntary, context-sensitive guidance—not a law, certification, or reliability guarantee. Its risk-management approach supports a practical control design: define authorized uses, assign ownership, map affected people and systems, measure performance in the relevant context, and manage identified risks over time.
Sources:S12
DomyClass analysis suggests controls such as classifying analyses by consequence; restricting sensitive data; logging prompts, data, code, packages, and model versions; setting review criteria before results are known; testing failure cases; and creating escalation to a qualified statistician. High-impact decisions require stronger evidence than exploratory work.
The human-AI arrangement is itself part of the system. Controls should specify who may accept a method, who can override it, what competence is required, and when automation must stop. A checkbox labeled “human reviewed” is weak evidence unless the reviewer can inspect the inputs, reproduce the analysis, understand uncertainty, and challenge the recommendation. This is the article’s BUSN600 connection: responsible adoption depends on validation, auditability, accountability, and fit-for-purpose risk decisions.
What the evidence does not establish
- The evidence does not show that any AI system always—or usually in every domain—chooses the right statistical test. It does not create one ranking across P-Bench, StatABench, StatLLM, and StatQA.References:S01S03S05S07
- The two headline 2026 benchmark papers are preprints and may be revised. Their results do not become peer-reviewed findings merely because code or datasets are public.References:S01S02S03S04
- StatLLM is peer reviewed, but its tasks specify the SAS analysis and its evaluated model set is not a current frontier comparison. StatQA is also peer reviewed, yet it measures a constrained 2024 selection task.References:S05S06S07
- No benchmark score establishes reliability for a new discipline, population, software stack, prompt, tool configuration, or consequence level. Statistical validity can depend on domain knowledge not represented in a dataset.References:S01S03S05S12
- The studies do not prove that AI should never be used for statistics. They support the narrower finding that failures can occur at method, tool, numerical, interpretation, and reporting layers and that the complete human-AI process needs context-specific evaluation.References:S01S03S05S12
- Human reviewers can also make errors. Human oversight is a necessary control in many settings, not an automatic guarantee that an analysis is correct.References:S13S14
Related DomyClass resources
For students examining statistical analysis, AI-assisted decision-making, and research methods, these DomyClass resources connect the evidence to relevant course and study contexts. These are educational relationships only. The linked courses, universities, benchmark authors, NIST, ASA, and software projects did not participate in or endorse this DomyClass analysis.
Sources and research status
DomyClass reviewed the cited benchmark papers and official statistical guidance directly. Preprints may be revised, and benchmark results apply to the stated tasks, models, tools, and evaluation settings.
Research reviewed through: August 29, 2026
- S01Fisher-R1: Training LLM Agents for Reliable Hypothesis TestingJiacheng Miao, Jin Mu, Guanhua Chen, and James Zou — arXiv v1 preprintPublished August 7, 2026Reviewed August 29, 2026
- S02P-Bench public dataset releaseFisher-R1 authors — public benchmark datasetReviewed August 29, 2026
- S03StatABench: Dataset and Framework for Evaluating Statistical Analysis Capabilities of LLMsYouxin Zhu, Yixuan Ding, Peng Lai, Longyue Wang, Bingyi Jing, and Guanhua Chen — arXiv v1 preprintPublished June 22, 2026Reviewed August 29, 2026
- S04StatABench public code and data releaseStatABench authors — public benchmark repositoryReviewed August 29, 2026
- S05StatLLM: A Dataset for Evaluating the Performance of Large Language Models in Statistical AnalysisSong, Lee, Xie, Liu, Deng, and Hong — Scientific Data, peer-reviewed Data DescriptorPublished February 6, 2026Reviewed August 29, 2026
- S06StatLLM-v1.0.3 datasetStatLLM authors — Zenodo research datasetReviewed August 29, 2026
- S07Are Large Language Models Good Statisticians?Zhu, Du, Li, Luo, and Tang — NeurIPS 2024 Datasets and Benchmarks Track, peer reviewedPublished 2024Reviewed August 29, 2026
- S08Quantitative TechniquesNIST/SEMATECH e-Handbook of Statistical Methods — official statistical guidanceReviewed August 29, 2026
- S09Techniques for Testing AssumptionsNIST/SEMATECH e-Handbook of Statistical Methods — official statistical guidanceReviewed August 29, 2026
- S10How can I tell if a model fits my data?NIST/SEMATECH e-Handbook of Statistical Methods — official statistical guidanceReviewed August 29, 2026
- S11Statement on Statistical Significance and P-ValuesAmerican Statistical Association Board — official statistical guidancePublished March 7, 2016Reviewed August 29, 2026
- S12Artificial Intelligence Risk Management Framework (AI RMF 1.0)National Institute of Standards and Technology — official AI-risk guidancePublished January 26, 2023Reviewed August 29, 2026
- S13Appendix C: AI Risk Management and Human-AI InteractionNIST AI Resource Center — official AI-risk guidanceReviewed August 29, 2026
- S14Artificial Intelligence Risk Management Framework: Generative Artificial Intelligence ProfileNational Institute of Standards and Technology — official AI-risk guidancePublished July 26, 2024Reviewed August 29, 2026
- S15Test for Association/Correlation Between Paired SamplesR Core Team — official R stats documentationReviewed August 29, 2026
- S16Fisher Exact Test for Count DataR Core Team — official R stats documentationReviewed August 29, 2026
- S17Pearson Chi-Squared Test for Count DataR Core Team — official R stats documentationReviewed August 29, 2026
Research releases, datasets, and guidance may be revised or maintained after publication. Contact DomyClass to suggest a correction.
Get Help With DSRT 734 Inferential Statistics in Decision-Making at University of the Cumberlands
Get targeted DSRT 734 help and improve your grades.
Get DSRT 734 Help