News Analysis
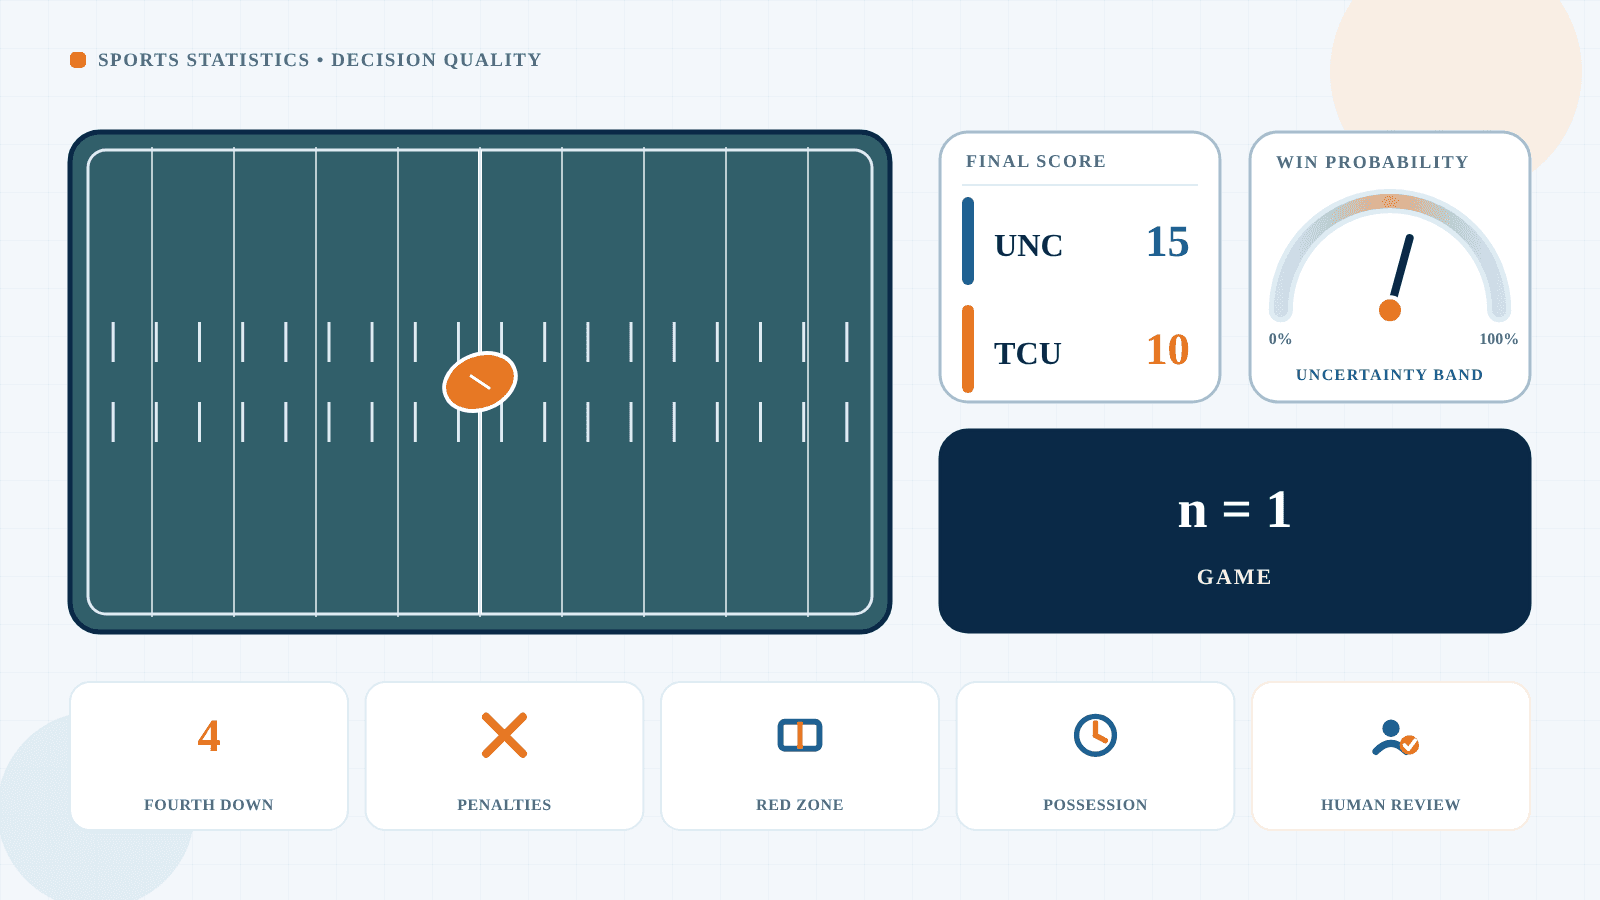
UNC vs. TCU 2026: What the 15–10 Win Teaches About Win Probability and Small Samples
North Carolina (UNC) beat Texas Christian University (TCU) 15–10 in Dublin, but one result is not a complete verdict on either team—or on the forecasts made before kickoff. The box score offers a timely lesson in probability, leverage, and statistical restraint.
By DomyClass
Published
At a glance
- Central lesson
- One observed result adds evidence, but it does not settle the underlying probability or a season-long question.References:S08S10
- Notable contrast
- UNC averaged more yards per play even though TCU ran more plays and possessed the ball longer.References:S03S04S05
- Research status
- Official game data reviewed through August 30, 2026.
What happened in Dublin
UNC and TCU each scored 10 points in the first quarter at Aviva Stadium. UNC opened with a field goal, TCU answered with a field goal and a touchdown, and UNC tied the game with a touchdown before the quarter ended. TCU did not score again. A second-quarter safety put UNC ahead 12–10, and a third-quarter field goal produced the 15–10 final score.
The official gamebook has a single weather field that says sunny, while UNC’s recap describes intermittent rain in the first half and heavier rain during parts of the second. Those records are best read as time-bounded: an opening-condition field does not necessarily summarize conditions across more than three hours of play.
What the official box score shows
The ACC and both team-hosted gamebooks agree on the figures below. They are descriptive statistics: compact records of what was counted in this game. The final two columns keep those measurements separate from stronger causal or season-long claims.
| Metric | UNC | TCU | What it describes | What it cannot prove |
|---|---|---|---|---|
| Final score | 15 | 10 | Points recorded in this game. | Season-long team quality or forecast calibration.References:S03S04S05 |
| First downs | 20 | 17 | Counted drive extensions. | Which team controlled every phase.References:S03S04S05 |
| Total yards | 322 | 281 | Net offense accumulated. | That yardage alone caused the result.References:S03S04S05 |
| Total plays | 57 | 71 | Recorded offensive-play volume. | Independent samples of team quality.References:S03S04S05 |
| Yards per play | 5.6 | 4.0 | Average gain across official plays. | Future efficiency against other opponents.References:S03S04S05 |
| Possession | 26:58 | 33:01 | Time credited with possession. | Superiority or scoreboard control.References:S03S04S05 |
| Third down | 3 of 11 | 7 of 16 | Conversions on counted third downs. | A stable conversion ability from one game.References:S03S04S05 |
| Fourth down | 1 of 1 | 1 of 5 | Conversions on counted fourth downs. | Whether each decision was correct ex ante.References:S03S04S05 |
| Red-zone scores/chances | 3 of 4 | 2 of 4 | Scores of any type in red-zone chances. | Touchdown rate or a sole cause of victory.References:S03S04S05 |
| Penalties | 3 for 20 yards | 11 for 89 yards | Accepted penalty count and yardage. | That penalties alone determined the game.References:S03S04S05 |
| Fumbles lost | 2 | 1 | Lost fumble possessions. | A combined turnover margin including downs.References:S03S04S05 |
| Sacks by defense | 3 | 3 | Official sacks credited to each defense. | Equal overall defensive performance.References:S03S04S05 |
| Field goals | 2 of 3 | 1 of 1 | Made and attempted field goals. | What unchosen kicks would have produced.References:S03S04S05 |
The most revealing statistical contrasts
UNC gained 322 yards to TCU’s 281, a 41-yard advantage. More revealing than the modest total-yard gap is how the teams accumulated those yards: UNC’s official 5.6 yards per play exceeded TCU’s 4.0 despite running 14 fewer plays. UNC also generated 232 passing yards on 28 attempts, compared with TCU’s 175 on 32, which works out to 8.3 and 5.5 passing yards per attempt. Those are descriptions of this matchup, not permanent offensive ratings.
TCU ran 71 plays to UNC’s 57 and possessed the ball for 33:01, six minutes and three seconds longer. Yet TCU scored fewer points. That mismatch is a useful warning against treating possession time as proof of control: possession reflects drive length, pace, field position, clock conditions, and what happened on earlier possessions. It is one part of the game’s structure, not a summary verdict.
Down-to-down results point in different directions. TCU converted 7 of 16 third downs, or 43.8%, while UNC converted 3 of 11, or 27.3%. On fourth down, UNC converted its only attempt and TCU converted 1 of 5. UNC recorded scores on 3 of 4 red-zone chances; TCU did so on 2 of 4. Each fraction matters within the relevant drives, but none can carry the full causal burden for a five-point game.
The penalty contrast was large: TCU had 11 penalties for 89 yards, compared with UNC’s 3 for 20. TCU also lost one fumble, while UNC lost two; neither team threw an interception. Those facts resist a tidy single-stat narrative. The final score emerged from interacting sequences of field position, down and distance, scoring opportunities, possession changes, and execution.
Why one game is a small sample
For a broad claim about season-long team quality, this result is one game-level observation. Calling it a small sample is not a way to discard the result. It is a reminder to match the strength of a conclusion to the amount and kind of evidence available. The game belongs in the evidence set; it should not be mistaken for the entire evidence set.
Sources:S10
The play counts do not turn the game into 57 independent UNC trials and 71 independent TCU trials. Plays are sequential. Score, clock, field position, yards to go, weather, opponent behavior, play calling, and prior events affect what comes next. Every non-tied game also assigns the same win-or-loss outcome to all of one team’s plays. Treating those plays as independent season replications would exaggerate the effective information.
A season introduces more variation: different opponents, injuries, roster availability, tactical adjustments, travel, and game states. Unusual events—such as a safety after a bad snap—can be highly consequential without representing a repeatable baseline. More games allow analysts to see which patterns persist and which shrink toward a more ordinary range.
There is no universal number of observations that is automatically “enough.” Sample-size adequacy depends on the question, expected variability, assumptions, desired precision, and decision consequences. That is why this article reports descriptive statistics without manufacturing a t-test, regression, confidence interval, p-value, or claim of statistical significance from one game.
Sources:S10
A probability is not a prediction of certainty
A win probability represents uncertainty under a model and its inputs. It is not a promise. If a well-calibrated model assigns a 70% win probability to many comparable teams, losses should still occur in roughly 30% of those cases. That 70/30 example is illustrative; it is not a reported pregame probability for UNC or TCU.
Sources:S08
The less-likely outcome occurring is therefore not, by itself, evidence that probability has failed. Conversely, the more-likely outcome occurring does not prove the model was sound. A deterministic statement can be checked against one outcome; a probabilistic forecast must be evaluated across a collection of forecasts and outcomes.
Sources:S08
Calibration asks whether events assigned similar probabilities occur at corresponding long-run rates. Discrimination asks whether the model meaningfully separates higher- and lower-risk cases. Other checks examine scoring rules, data quality, drift, and performance in relevant subgroups. One game supplies one forecast-outcome pair, not a calibration curve.
Sources:S08
Even a well-maintained model can be uncertain because its inputs are incomplete, its historical sample differs from the present matchup, or several plausible specifications produce different estimates. Responsible interpretation therefore asks what the number means, how it was validated, and how sensitive it is—not only whether the observed winner had the larger number.
Fourth-down decisions and model uncertainty
The official box score lists UNC at 1-for-1 and TCU at 1-for-5 on fourth down. The gamebook resolves an apparent wording difference in the official reports. TCU had three conventional turnovers on downs: an incomplete pass at the UNC 35, a stopped run at the UNC 5, and an incomplete pass at the UNC 10. A fourth failed attempt was the second-quarter bad-snap sequence that ended in a safety. TCU’s successful attempt was a four-yard completion on fourth-and-2 in the fourth quarter.
A conversion statistic records what happened after the snap; it does not grade the choice made before it. A serious fourth-down assessment needs the score, clock, field position, yards to go, timeouts, plausible kicking and conversion probabilities, opponent strength, weather, possession value, and the objective being optimized. Expected points and win probability are related but not interchangeable.
The model itself also deserves scrutiny. Brill, Yurko, and Wyner studied fourth-down recommendations using NFL play-by-play—not this college game—and showed that point estimates can conceal substantial uncertainty. Their analysis used historical NFL data and bootstrap procedures to examine how often recommended choices remain stable when the data are resampled. Its applicable lesson here is humility about estimated advantages, not a verdict on any UNC–TCU call.
Sources:S07
It would also be wrong to rewrite the final score by simply substituting field goals for failed attempts. A different choice changes the next kickoff or field position, the clock, later play calls, timeout use, and both teams’ responses. The observed sequence cannot support a clean claim that an unchosen option would have produced a particular final score.
Sources:S04
Penalties, red-zone outcomes, and leverage
TCU’s 11 penalties for 89 yards were one meaningful part of the game’s field-position and drive context. Penalties can erase a gain, create a longer down-and-distance problem, extend an opponent’s possession, or move a kick. Their effects depend on timing and the alternative state of the drive. The 69-yard penalty differential is descriptive; it does not isolate how many points the penalties caused.
Red-zone opportunities compress the field, reducing the space a defense must protect. UNC scored on 3 of 4 such chances, or 75%, while TCU scored on 2 of 4, or 50%. These are red-zone scoring rates, not touchdown rates: UNC’s three scores included two field goals, and TCU’s two included one. A fourth-down play in this area can carry unusual leverage because it affects both a scoring opportunity and the opponent’s next field position.
The factors interact. A penalty may create fourth-and-long; a failed fourth down may leave an opponent deep in its own territory; a lost fumble may create a short field; weather may change kicking and ball-security assumptions. The box score identifies the ingredients, but it does not perform a controlled experiment that assigns a unique causal share to each one.
Outcome bias after the final whistle
Once the score is known, a successful conservative choice can look automatically wise and a failed aggressive choice automatically foolish. That is outcome bias: allowing knowledge of the result to distort the evaluation of a decision made under uncertainty. Baron and Hershey demonstrated the pattern in studies involving medical and monetary decisions; their paper did not study football, but the distinction between decision quality and outcome quality transfers cautiously.
Sources:S09
A fair review reconstructs the information available at the time. What did the decision-maker reasonably know about distance, field position, clock, score, weather, personnel, and the available alternatives? Was the probability estimate calibrated for a relevant population? Were the costs and benefits defined correctly? The eventual conversion or failure is evidence about what occurred, not a complete audit of the earlier reasoning.
This distinction is not a blanket excuse. Repeated outcomes can reveal misspecified probabilities, weak execution assumptions, or a poor process. The safeguard is to assess the ex ante reasoning and then update it with accumulated evidence, rather than letting one favorable result sanctify every choice or one unfavorable result condemn it.
What AI sports forecasts can get wrong
An AI-generated sports forecast can sound exact while resting on incomplete or stale evidence. Training data may not reflect roster turnover, a new coaching system, recent injuries, travel, weather, or interactions specific to the opponent. If the system does not identify its data cutoff and inputs, a polished percentage can conceal an uncertain foundation.
Sources:S07
Models can also be poorly calibrated, validated on a different competition, or evaluated only by whether their highest-probability choice won. A useful audit asks for performance across many games, appropriate comparison baselines, uncertainty or sensitivity ranges, and separate results for situations resembling the current use. A black-box number without those checks is difficult to trust or improve.
Language models add another risk: they may hallucinate statistics, merge seasons, invent injuries, or explain a number that came from no reproducible model. Confident language is not evidence quality. Students should verify the official gamebook, request the formula or model source, inspect assumptions, and distinguish sourced facts from generated interpretation.
This is also the connection to BUSN600 and responsible AI practice: prediction systems need human oversight, auditability, scope limits, and monitoring. The related DomyClass analysis Can AI Choose the Right Statistical Test? examines the same broader problem in another setting—fluent output is not a substitute for defensible method selection and validation.
How beliefs should update after one game
Before kickoff, a forecast may combine prior seasons, roster and coaching changes, player availability, opponent information, and model assumptions. Those inputs produce a prior view with uncertainty. The postgame task is not to preserve that view at all costs or replace it with the scoreboard alone.
After the game, add the 15–10 result and inspect process statistics in context: UNC’s yards-per-play advantage, TCU’s extra plays and longer possession, the penalty difference, fumbles, fourth-down sequences, red-zone results, field position, and changing conditions. Then ask which events are likely to repeat and how strong the opponent proves to be. A result against a team later shown to be excellent may carry different information than it appeared to carry on opening weekend.
The bounded update is straightforward: the result supplies new information, so beliefs should move. The amount of movement should reflect measurement quality, prior uncertainty, how diagnostic the observed process is, and how unusual the game context was. Without a specified model, this article does not calculate a posterior season probability. More games should trigger further revision.
Sources:S10
A better postgame evaluation checklist
A disciplined review can be concise without becoming simplistic. Use the following sequence for a game, an AI forecast, or another decision made under uncertainty.
1. Verify the record
Confirm the official score, gamebook, corrections, and definitions before interpreting a statistic.
2. Separate facts from causes
Label box-score values as descriptive and identify every claim that tries to explain why the result occurred.
3. Locate high-leverage events
Inspect red-zone snaps, fourth downs, possession changes, short fields, and late-game situations in context.
References:S04
4. Account for game state
Ask how score, clock, field position, weather, and opponent responses shaped the observed statistics.
5. Respect dependence
Do not treat sequential plays from one game as independent season-level samples.
References:S07
6. Reconstruct the choice
Judge a decision using the credible information and alternatives available when it was made.
References:S09
7. Evaluate many forecasts
Assess calibration and comparative performance across a relevant set of probability forecasts.
References:S08
8. State what changed
Identify which beliefs should move after the result and the process evidence supporting that movement.
9. State what did not
Name the season, causal, model-validity, and decision-quality conclusions that one game cannot establish.
10. Revisit the assessment
Update the conclusion as additional games, opponent evidence, injuries, and model checks become available.
References:S10
What can and cannot be concluded
Supported by the current record
UNC won 15–10. UNC gained more total yards and more yards per play. TCU ran more plays and possessed the ball longer. The official box score lists TCU at 1-for-5 on fourth down. TCU had 11 penalties for 89 yards. The result provides new information about both teams.
Not established by one game
The record does not establish that pregame models were defective, UNC is definitively stronger across a season, TCU’s choices were objectively wrong, penalties alone caused the loss, one result predicts the full season, or AI models cannot analyse football.
Related DomyClass resources
These resources extend the article’s statistical, inferential, and responsible-AI concepts. The linked institutions did not participate in preparing this game analysis.
Sources and methodology
DomyClass analysed official game data and cited statistical research to explain probability, uncertainty, and decision-making. The article does not use a proprietary win-probability model and does not provide betting advice.
Game data reviewed through: August 30, 2026
- S01Defense Dominates As Football Tops TCU, 15-10UNC AthleticsOfficial team recapPublished August 29, 2026Reviewed August 30, 2026
- S02TCU Falls to North Carolina, 15-10, in DublinTCU AthleticsOfficial team recapPublished August 29, 2026Reviewed August 30, 2026
- S03North Carolina vs. TCU Box ScoreAtlantic Coast ConferenceOfficial conference box scorePublished August 29, 2026Reviewed August 30, 2026
- S04Football vs TCU on August 29, 2026 — Box Score and GamebookUNC AthleticsOfficial box score, drive chart, and play-by-playPublished August 29, 2026Reviewed August 30, 2026
- S05Football vs North Carolina on August 29, 2026 — Box Score and GamebookTCU AthleticsOfficial box score, drive chart, and play-by-playPublished August 29, 2026Reviewed August 30, 2026
- S06TCU Horned Frogs vs North Carolina Tar HeelsCollege Football IrelandOfficial event pagePublished Event page for August 29, 2026Reviewed August 30, 2026
- S07Analytics, Have Some Humility: A Statistical View of Fourth-Down Decision MakingRyan S. Brill, Ronald Yurko, and Abraham J. Wyner; The American StatisticianPeer-reviewed statistical research using NFL dataPublished April 22, 2025Reviewed August 30, 2026
- S08Verification of Forecasts Expressed in Terms of ProbabilityGlenn W. Brier; Monthly Weather ReviewPeer-reviewed probability-forecast researchPublished January 1950Reviewed August 30, 2026
- S09Outcome Bias in Decision EvaluationJonathan Baron and John C. Hershey; Journal of Personality and Social PsychologyPeer-reviewed decision-research articlePublished 1988Reviewed August 30, 2026
- S10Sample Sizes RequiredNIST/SEMATECH e-Handbook of Statistical MethodsAuthoritative statistical guidanceReviewed August 30, 2026
Game data reviewed through August 30, 2026. Official sources can publish later statistical corrections. Contact DomyClass to suggest a correction.
Get Help With DSRT 734 Inferential Statistics in Decision-Making at University of the Cumberlands
Get targeted DSRT 734 help and improve your grades.
Get DSRT 734 Help